| dc.contributor.author | Beckman, Sarah | |
| dc.date.accessioned | 2017-07-05T17:46:08Z | |
| dc.date.available | 2017-07-05T17:46:08Z | |
| dc.date.issued | 2016 | |
| dc.identifier.uri | http://hdl.handle.net/10106/26857 | |
| dc.description | KINE 4400 | en_US |
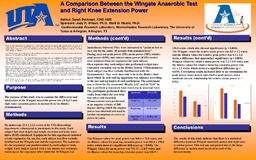
| dc.description.abstract | INTRODUCTION: Anaerobic power is maximal power developed during utmost, short term physical effort. Anaerobic activities use energy that is stored in muscles and that can be accessed without the use of oxygen. Power is measured in watts (W) and relative power is measured by watts per kilogram of body weight (W/kg). Research shows that there are correlations between Wingate power and other anaerobic activities such as field tests, vertical jumping, and cycling tests.
PURPOSE: The purpose of this study was to examine the differences and similarities of the Wingate anaerobic power test (WAnT) and right knee extension power as measured on the Biodex3 Dynamometer.
METHODS: Six males (age22.4+1.13yrs) of the UTA Kinesiology department, volunteered to participate in this study. Each subject had their height and weight recorded and body mass index (BMI) calculated. Each subject performed one 30 second Wingate test on the Lode cycle ergometer. During each test peak power (PP), mean power (MP), relative peak power (RPP), and relative mean power (RMP) for each subject were obtained from the ergometer. Each subject also performed a right knee extension test on the Biodex System 3 Dynamometer. Measurements were performed at an angular velocity of 360 deg/sec during which the angular power was obtained and used in other calculations.
RESULTS: The Wingate values for peak power was 569.4±72.8 watts, and the Biodex values for peak leg extension power was 343.6±194.6 watts, which showed a significant difference (p=0.048). The Wingate values for mean power was 731.33±110.5 watts, and the Biodex values for mean leg extension power was 438.9±236.5 watts, which also showed significance (p=0.044).The Wingate values for relative peak power was 8.5±1.2 watts, and the Biodex values for relative peak power was 5.3±2.6 watts, a difference that approached significance (p=0.058). Wingate values for relative mean power was 7.2±0.9 watts, and the Biodex values for relative mean leg extension power was 4.1±2.1 watts, which showed a significant difference (p=0.039). Correlation results indicated little or no relationship for peak power, mean power, and relative peak power; and a moderate inverse relationship for relative mean power (r=-0.51).
CONCLUSION: The results of this study indicate that there is a statistical difference between Wingate anaerobic power and right knee extension power. This was not unexpected due to the large difference in muscle mass involved in each of the measurements. | en_US |
| dc.description.sponsorship | Wilson, Judy R. | en_US |
| dc.language.iso | en_US | en_US |
| dc.subject | Comparisons | en_US |
| dc.subject | Anaerobic activities | en_US |
| dc.subject | Wingate power | en_US |
| dc.subject | knee -- extension power | en_US |
| dc.subject | Statistics | en_US |
| dc.title | A Comparison Between the Wingate Anaerobic Test and Right Knee Extension Power | en_US |
| dc.type | Presentation | en_US |
| dc.publisher.department | Department of Kinesiology, The University of Texas at Arlington | en_US |
| dc.publisher.department | Cardiovascular Research Laboratory, The University of Texas at Arlington | en_US |
| dc.publisher.department | Biomechanics Research Laboratory, The University of Texas at Arlington | en_US |
| dc.publisher.department | Exercise Science Research Laboratories, The University of Texas at Arlington | en_US |