ATTENTION: The works hosted here are being migrated to a new repository that will consolidate resources, improve discoverability, and better show UTA's research impact on the global community. We will update authors as the migration progresses. Please see MavMatrix for more information.
Show simple item record
| dc.contributor.author | Liao, Y. | |
| dc.contributor.author | Desai, N. | |
| dc.contributor.author | Shen, Q. | |
| dc.contributor.author | Daniel, C.R. | |
| dc.contributor.author | Kopetz, S. | |
| dc.contributor.author | Basen-Engquist, K. | |
| dc.contributor.author | Schembre, S.M. | |
| dc.date.accessioned | 2021-07-15T20:28:16Z | |
| dc.date.available | 2021-07-15T20:28:16Z | |
| dc.date.issued | 2018-01 | |
| dc.identifier.uri | http://hdl.handle.net/10106/29952 | |
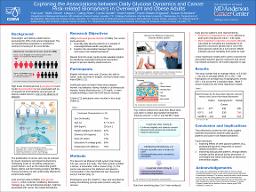
| dc.description.abstract | **Please note that the full text is embargoed** ABSTRACT: Introduction: High levels of blood glucose (hyperglycemia) and insulin (hyperinsulinemia) are associated with an increased risk of developing several types of obesity- and diet-related cancers, even in the absence of diabetes. The proliferation of cancer cells may be induced by insulin resistance and hyperinsulinemia by modulating levels of adiponectin and circulating endogenous growth factors, such as the insulin-like growth factors (IGF) and IGF binding proteins (IGFBP). These processes are also unfavorably affected by excess body weight, which could further increase cancer risk. Less is known about how daily glucose patterns and dynamics might be associated with cancer risk biomarkers. A better understanding of these associations could provide valuable insights for identifying meaningful behavioral intervention targets to prevent diet- and obesity-related cancers. The current study aimed to quantify daily glucose patterns and explore their relationships with cancer-related biomarkers, in a sample of free-living overweight and obese adults. Methods: Twelve overweight or obese adults (age = 47.7 [SD = 12.5] years, 75% female, 42% obese) without diabetes (i.e., fasting blood glucose < 125 mg/dL) completed a 7-day monitoring period. Blood glucose data were recorded every 5 minutes using the Dexcom G4 PLATINUM continuous glucose monitoring system (CGM). CGM data from monitoring days 3 to 7 were used to identify hyperglycemic events and to quantify blood glucose variability. Hyperglycemic events were defined as having a peak postprandial blood glucose concentrations > 140 mg/dL. The mean amplitude of glycemic excursions (MAGE), which indicates the glucose variability from peaks to nadir, was calculated by averaging the amplitudes of all glycemic excursions greater than 1 SD of the mean glucose values for a 24-h period. Glycosylated hemoglobin (HbA1c) and IGF-1, IGF-2, and IGFBP-2 levels were obtained by blood draw at the beginning of the monitoring period. Linear regression models were used to examine the association between glucose measures (i.e., HbA1c, frequency of hyperglycemia events, and MAGE) and cancer risk biomarkers (IGF-1, IGF-2, and IGFBP-2). All models were age adjusted. Results: The study sample had an average HbA1c level of 5.6 (SD = .22) and an average MAGE of 2.2 (SD = .69). Participants on average had 3 hyperglycemic events (SD = 3.4) across the 5 analytical days. HbA1c was marginally associated with frequency of hyperglycemic events (B = .613, p = .083). HbA1c was marginally associated with IGF-1 (B = .977, p = .050). MAGE was positively associated with IGF-2 (B = .709, p < .01). Frequency of hyperglycemic events was marginally associated with IGF-2 (B = .535, p = .073). Conclusions: The preliminary results from this study suggest that daily glucose patterns based on CGM data could be used as modifiable indicator for obesity-related cancer risk. Future diet and physical interventions could aim to improve daily glucose patterns of overweight and obese individuals as a cancer prevention strategy. | en_US |
| dc.language.iso | en_US | en_US |
| dc.title | Exploring the associations between daily glucose dynamics and cancer risk-related biomarkers in overweight and obese adults | en_US |
| dc.title.alternative | Poster presented at the American Association for Cancer Research Special Conference on Obesity and Cancer: Mechanisms Underlying Etiology and Outcomes, Austin, TX. | en_US |
| dc.type | Presentation | en_US |
Files in this item
- Name:
- Yue's AACR Poster 48x36 012318.pdf
- Size:
- 472.5Kb
- Format:
- PDF
- Description:
- PDF
This item appears in the following Collection(s)
Show simple item record